
Monitoring Dashboard: visualising the performance of Circular Economy Business Models
Deliverable D1.2.5 – Monitoring Dashboard has been finalised under the DECIDE project, adding a practical visualisation layer to support the monitoring of Circular Economy Business Models.
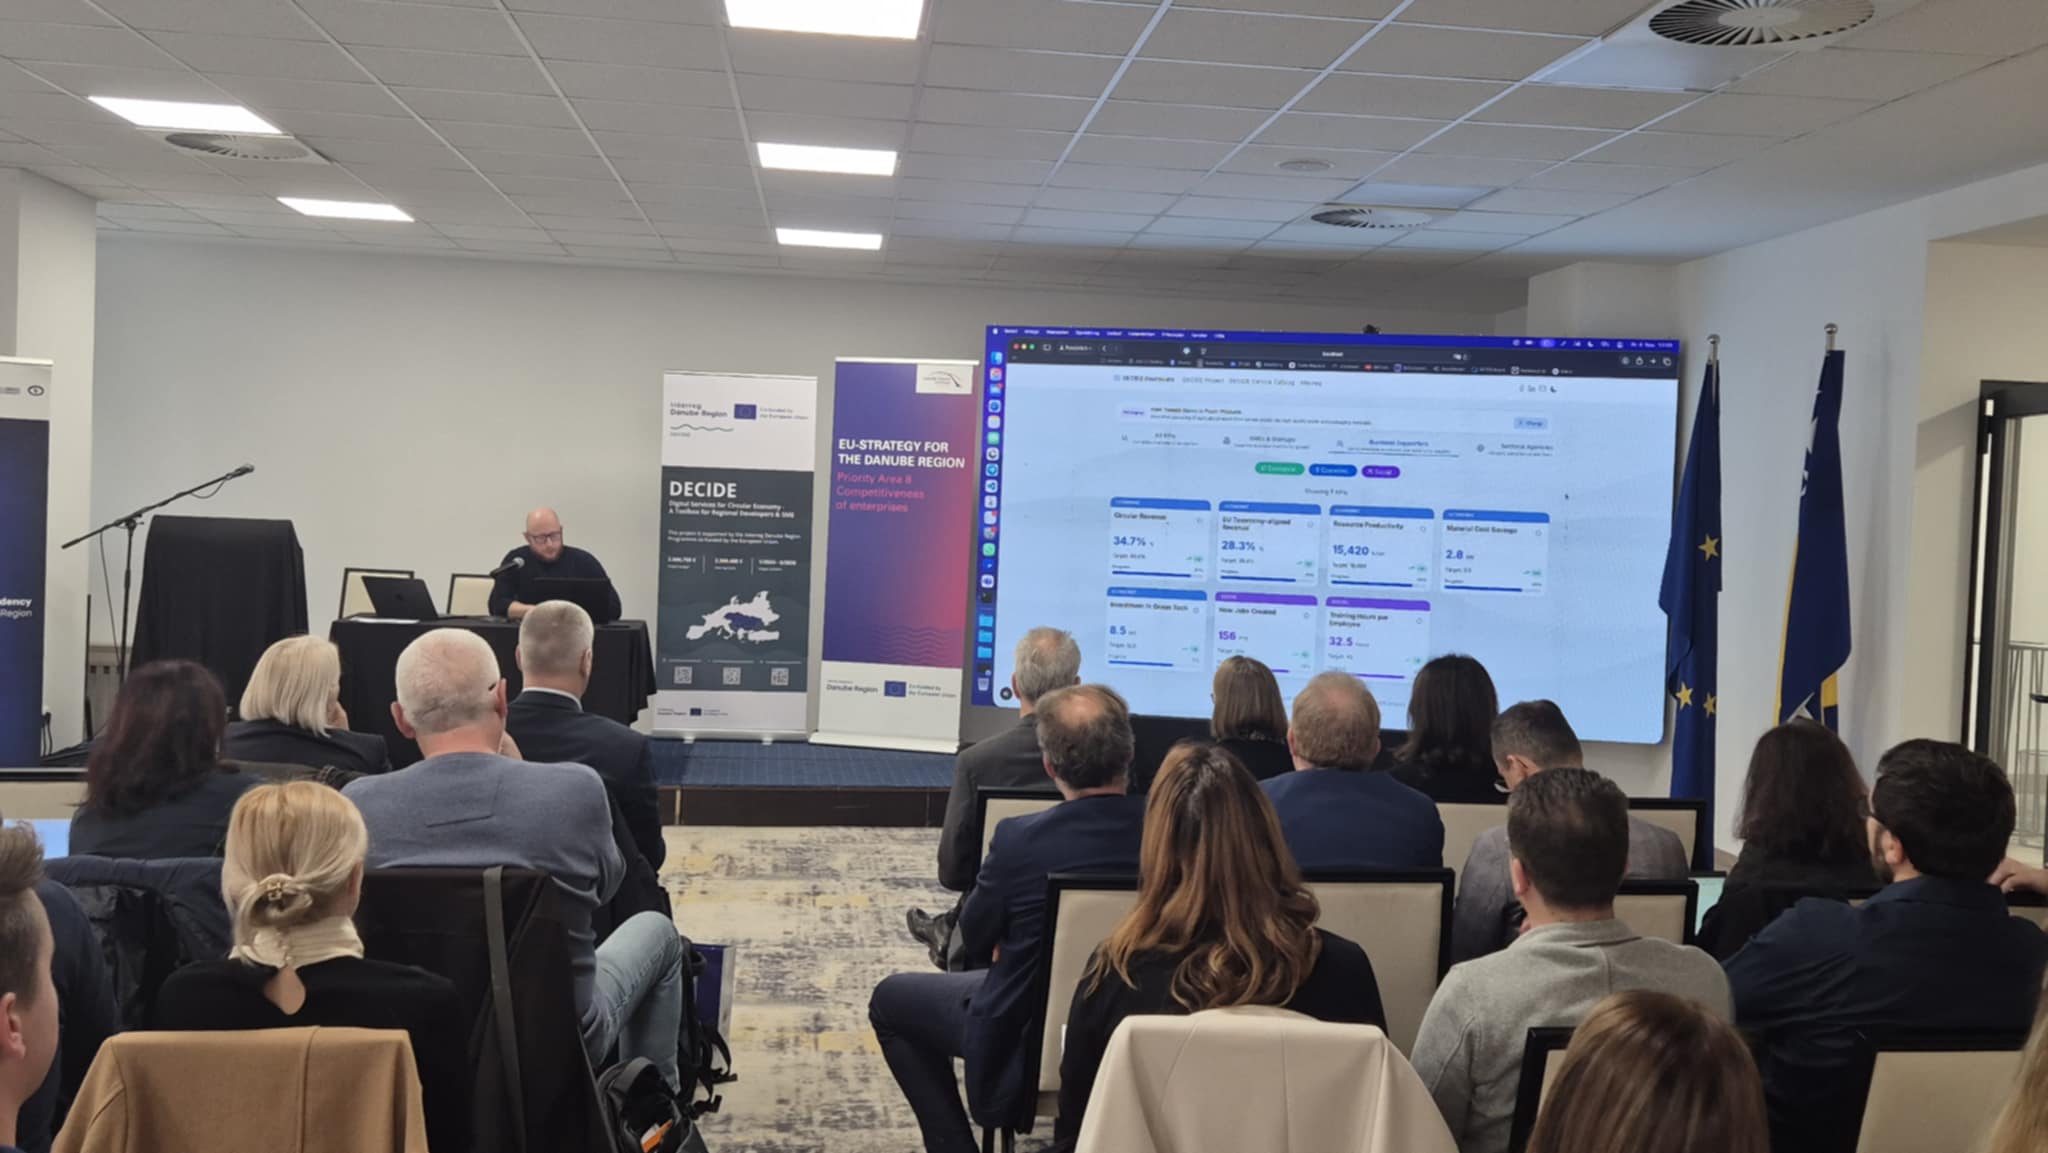
DECIDE Monitoring Dashboard was developed to add a practical visualisation layer to support the monitoring of the Circular Economy Business Models.
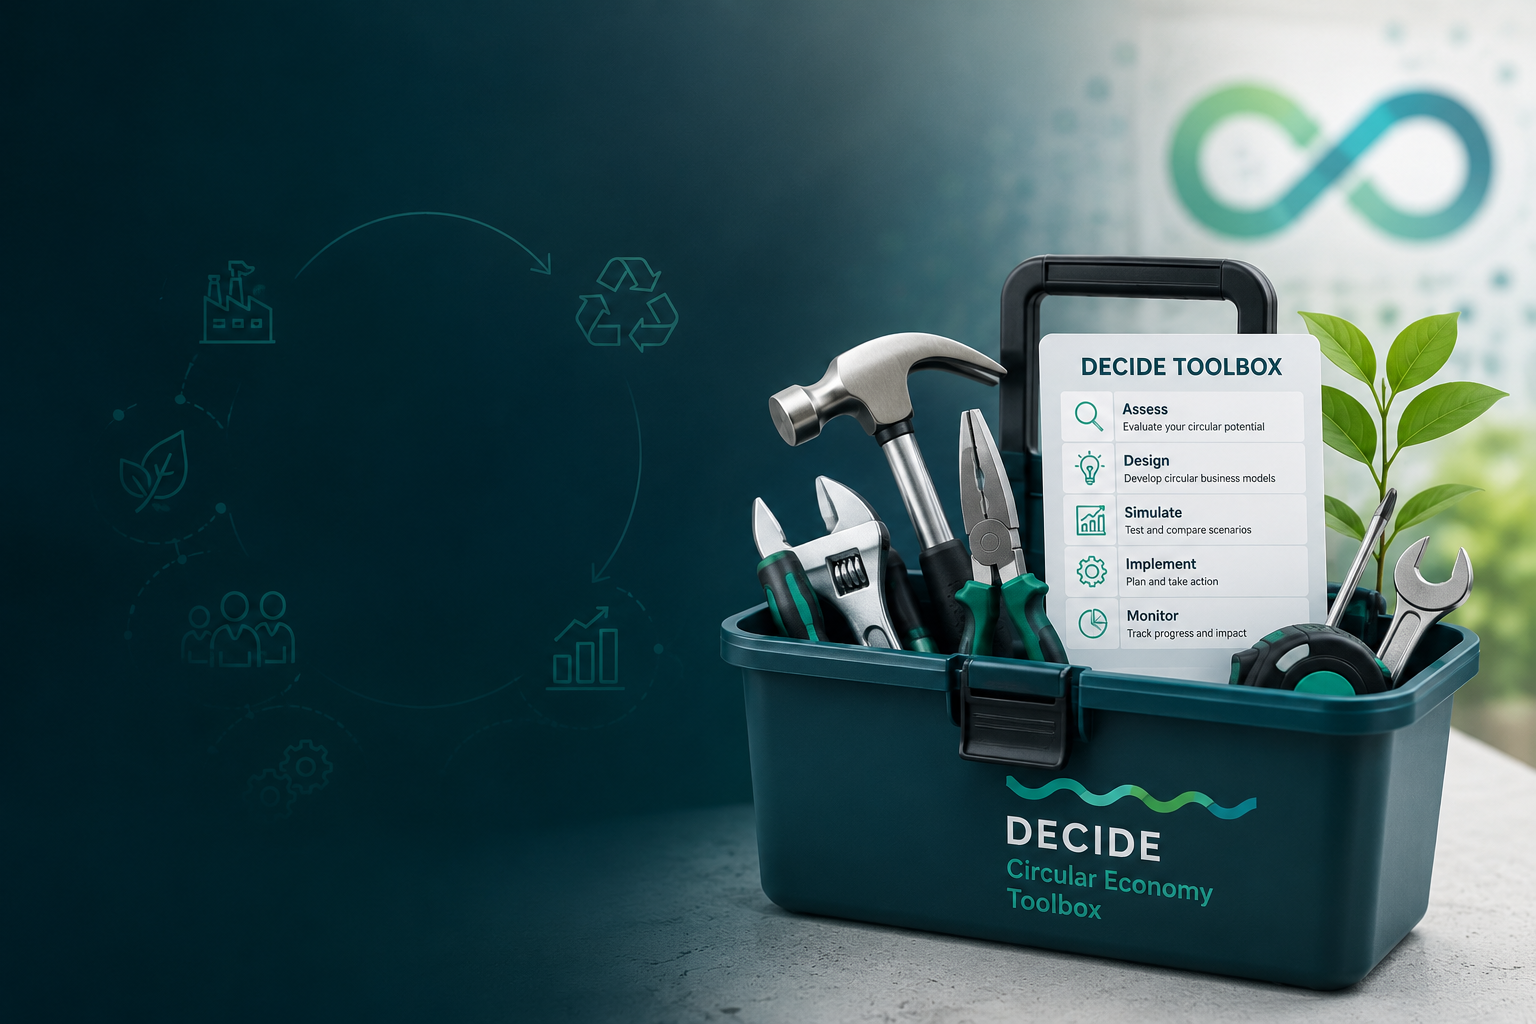
Circular business models often involve several actors, data sources and impact dimensions. For SMEs, pilot owners, business support organisations and public authorities, it is important not only to design a circular solution, but also to understand how it performs in practice. This includes economic, environmental and social effects, as well as the ability to follow relevant indicators in a clear and accessible way. The DECIDE Monitoring Dashboard was developed to make this easier. It visualises data from circular economy business models and pilot sites. It presents Key Performance Indicators through a web-based interface. Instead of requiring users to open several modelling tools or interpret technical data structures, the dashboard brings the main information together in one place.
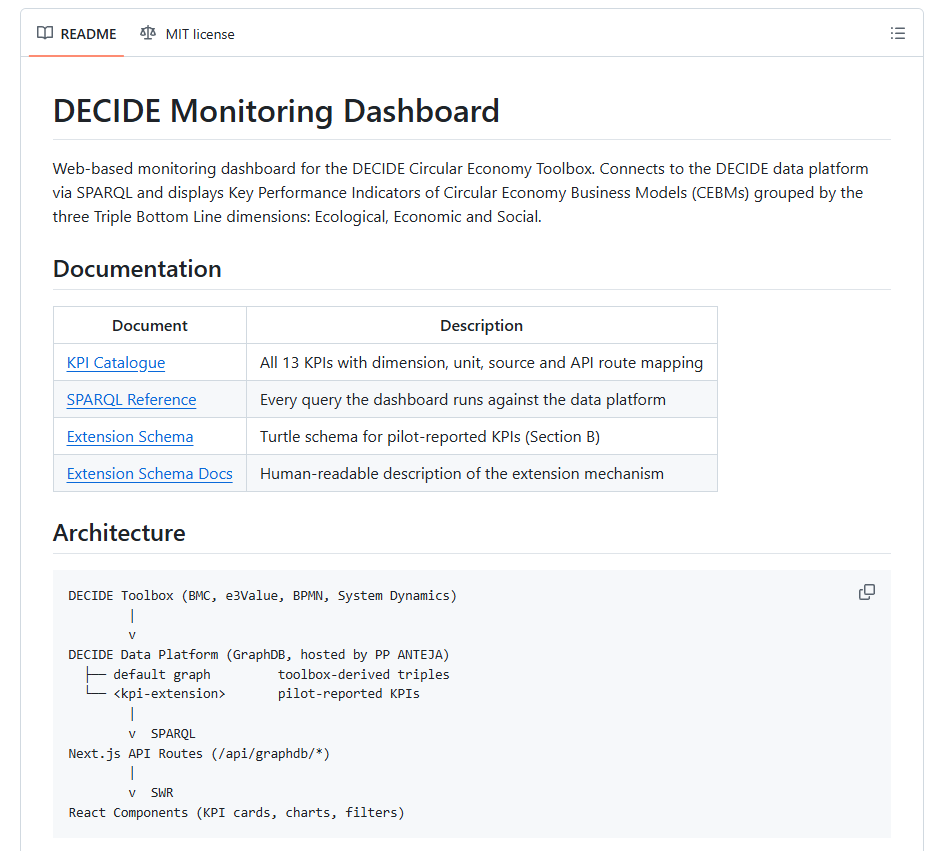
The dashboard is connected to the DECIDE data platform and retrieves data directly from it. It does not store pilot data itself. Every value shown on screen is retrieved from the platform when requested. This approach supports data consistency while keeping data protection at the level of the DECIDE data platform. A key feature of the dashboard is its structure around the three Triple Bottom Line dimensions: ecological, economic and social. This makes it easier for users to assess circular business models not only from a financial perspective, but also in terms of their wider sustainability contribution.
In total, the dashboard brings together 12 indicators. Seven indicators are automatically derived from DECIDE Toolbox models, including Business Model Canvas, e3Value and BPMN. Five additional indicators can be reported by pilot owners through a generic extension: CO₂ emission reduction, recycling rate, material reuse rate, circular revenue share and jobs created. This combination allows the dashboard to include both automatically generated information and pilot-specific data that cannot be derived directly from the modelling tools. As a result, users gain a broader and more realistic overview of circular business model performance.
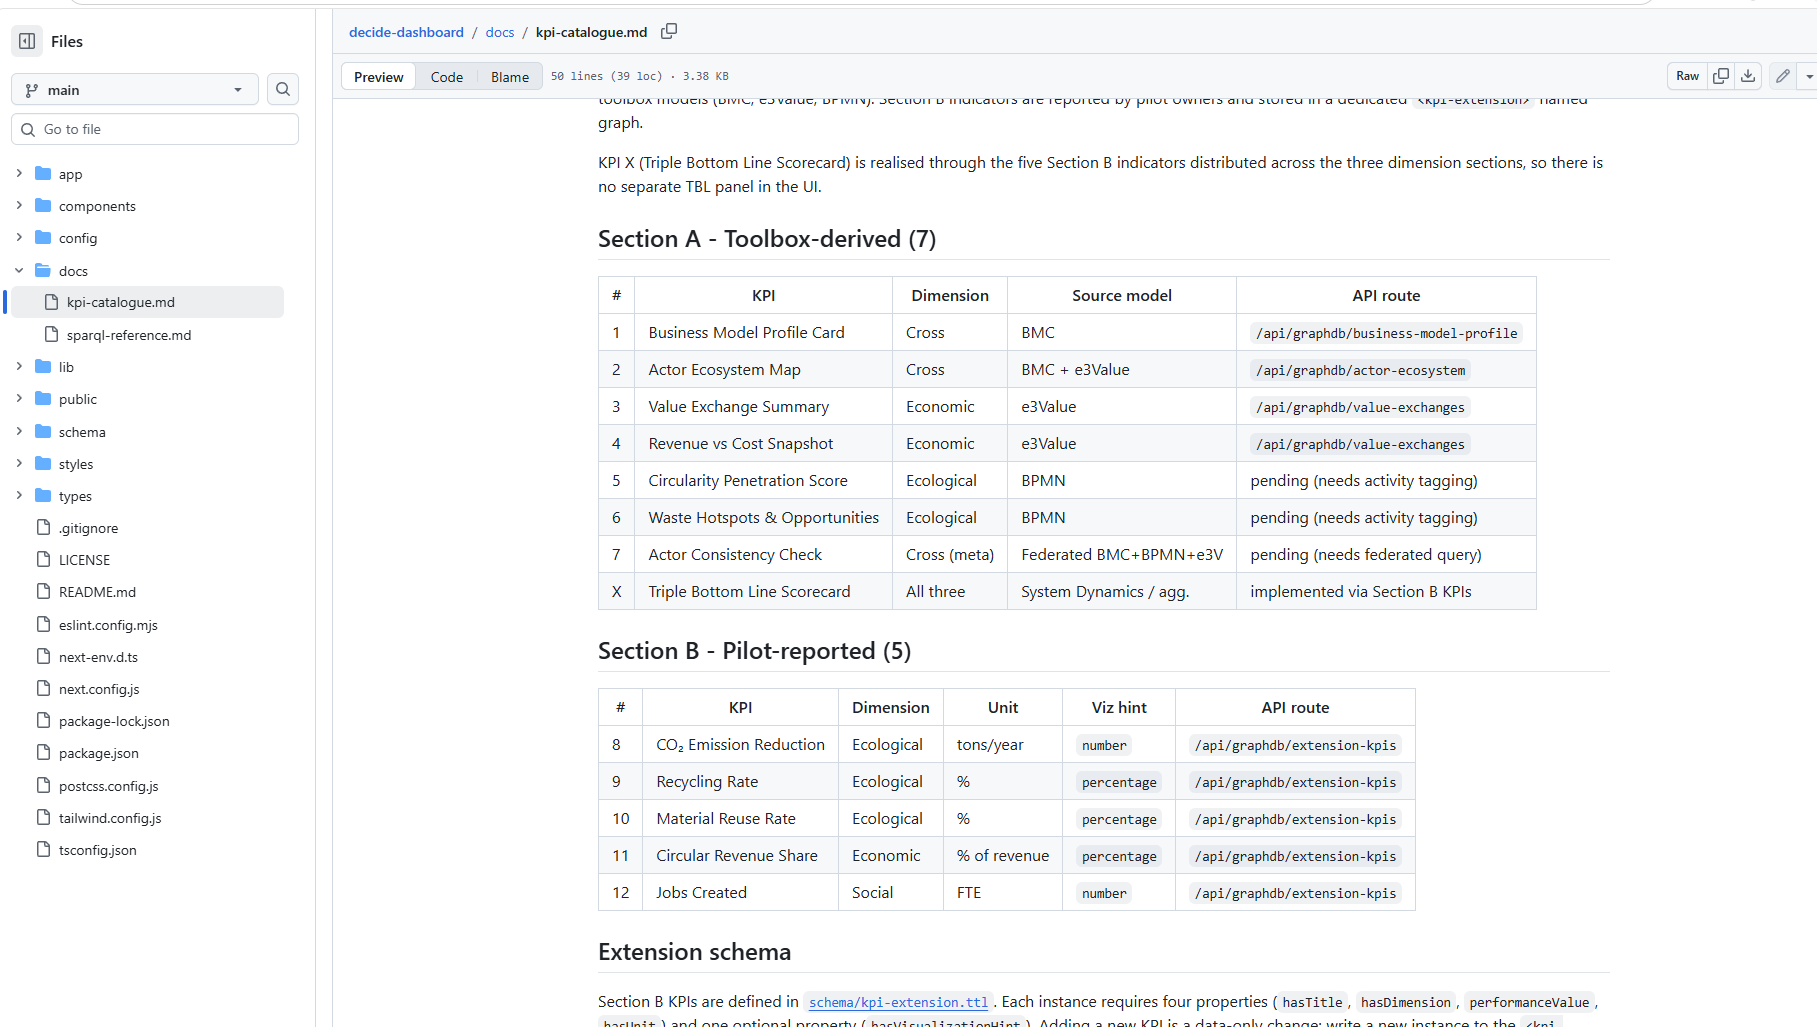
Monitoring Dashboard screenshot – KPI Catalogue
The dashboard provides two main views. The first is an aggregated overview of the available circular economy business models. The second is a detailed case view, which becomes available when a specific business model is selected. In this detailed view, users can explore the business model profile, actor ecosystem, value exchanges and relevant sustainability indicators. The Whey pilot case was used as the first end-to-end validated reference during development. This case helped confirm that the dashboard can connect data from different parts of the DECIDE environment and present it in a way that is understandable and useful for stakeholders.
For pilot owners and SMEs, the dashboard offers a self-explanatory way to follow the performance of a circular business model. It can help them understand where their model creates value, where additional data may be needed and how different sustainability dimensions are connected.
For business support organisations, cluster managers and regional development actors, the dashboard can support advisory work and communication with companies. It provides a clearer basis for discussing circular economy performance, identifying needs and presenting results to stakeholders.
For policymakers, sectoral agencies and academic users, the dashboard offers insight into exemplary circular economy business models and their potential impacts. This support learning, comparison and future work on circular economy policies, support measures and research.
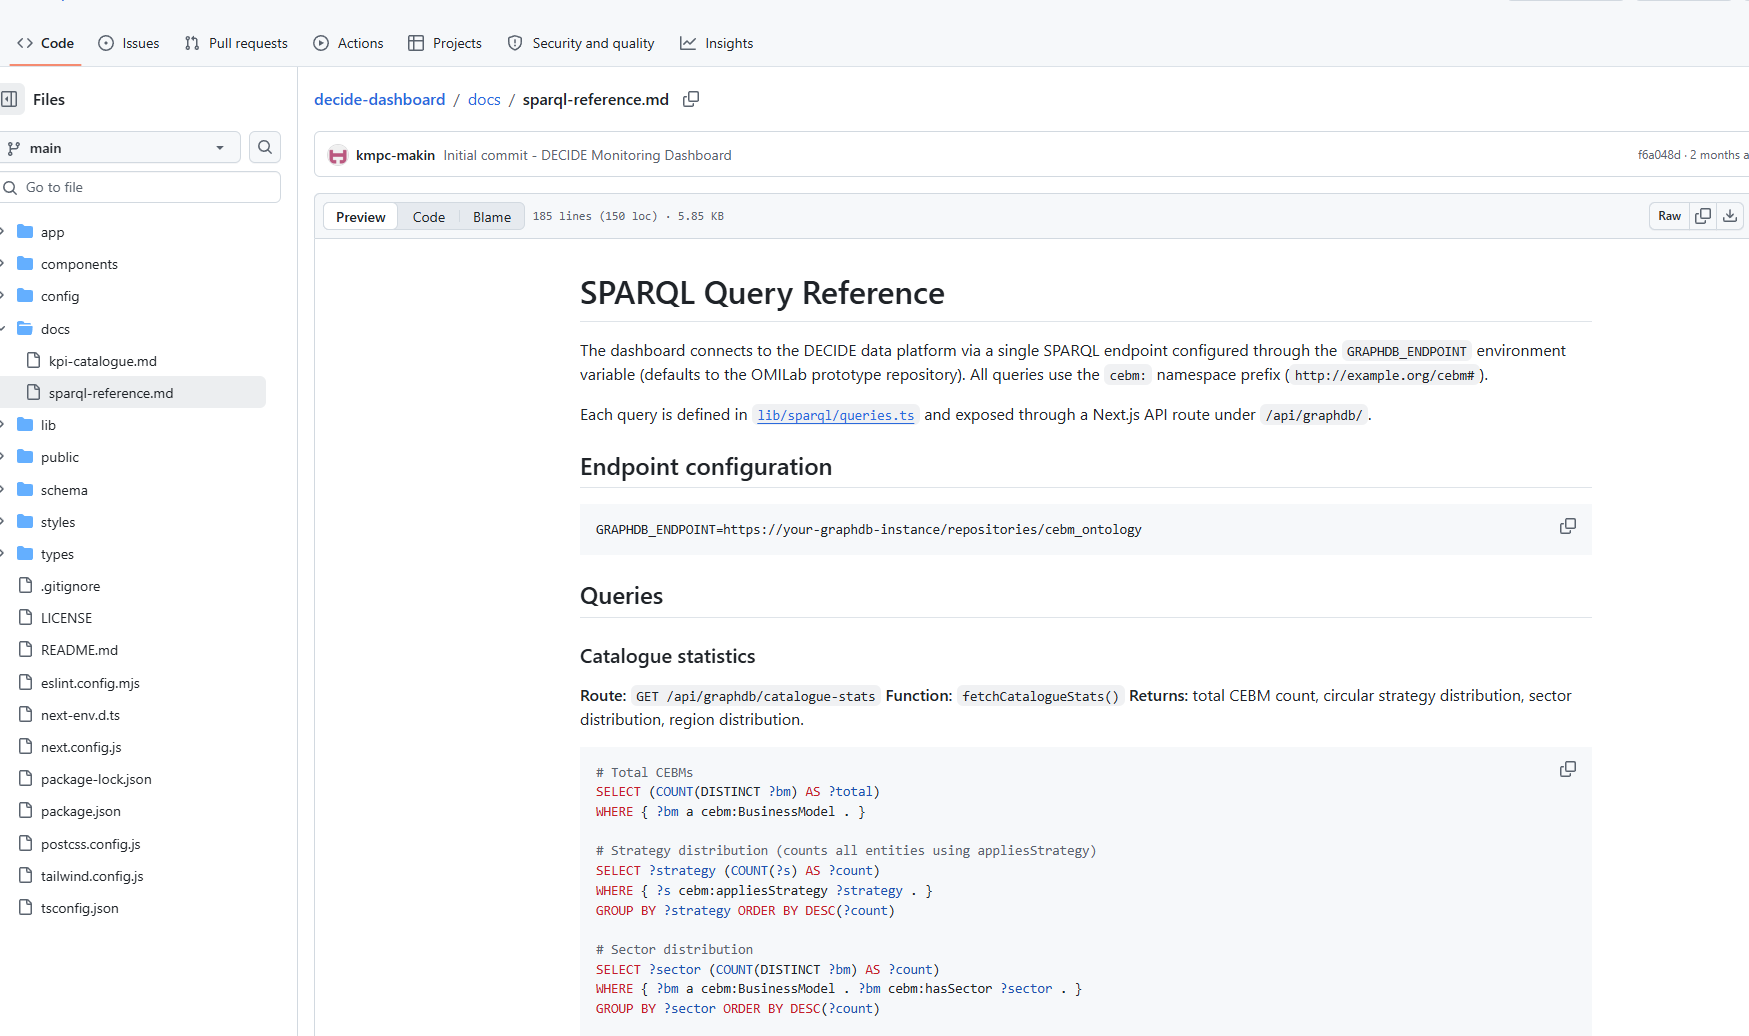
Monitoring Dashboard screenshot: SPARQL Query Reference
One of the strengths of the Monitoring Dashboard is its replicability. It is not limited to one sector or one pilot case. Any circular economy business model added to the DECIDE data platform can appear in the dashboard and be displayed through the same structure. Additional sector-specific or region-specific indicators can also be added without changing the dashboard code.
The dashboard is built on open web technologies and is designed for long-term use and further development. Its source code and documentation are available through the project repository, while the connection to the DECIDE data platform enables continued access to the underlying data source.
By finalising the Monitoring Dashboard, DECIDE has strengthened the practical use of its digital environment for circular economy assessment. The dashboard helps translate complex model data into clear, stakeholder-friendly information and supports more informed decisions on the development, implementation and transfer of circular business models. In this way, Deliverable D1.2.5 contributes to the wider objective of the DECIDE project: supporting the uptake of sustainable and resource-efficient business models across the Danube Region.
This article has been developed within the framework of the project Digital Services for Circular Economy - A Toolbox for Regional Developers & SMEs (DECIDE), co-financed by the Interreg Danube Region Programme under the 2021-2027 financial period. The content reflects the views of the authors and does not necessarily represent the official position of the DECIDE project, its partners, or the programme authorities.

30/06/2026
By Lea Trojnar Mustak
Share on social media:


Smart

News & Events
Read the most recent updates and explore the upcoming events.


Would you like to receive project updates?
You're already part of our community!
Welcome to our newsletter community!
Subscribe to our newsletter